

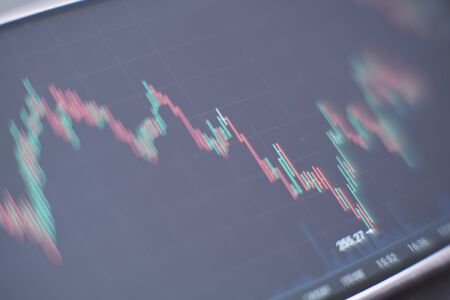
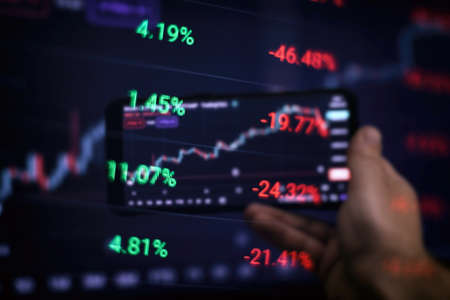
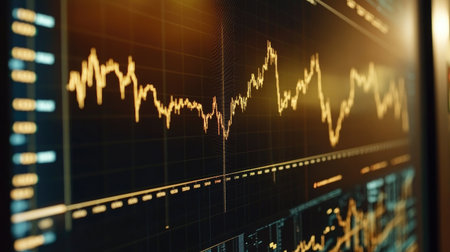
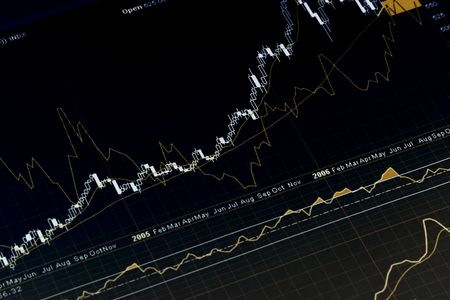
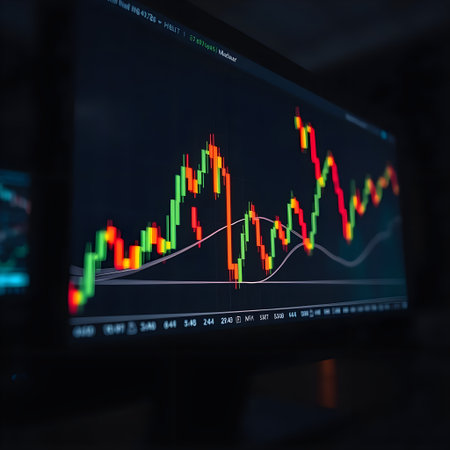
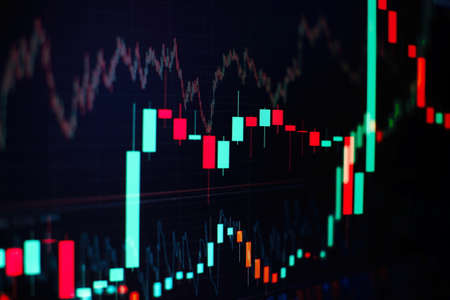
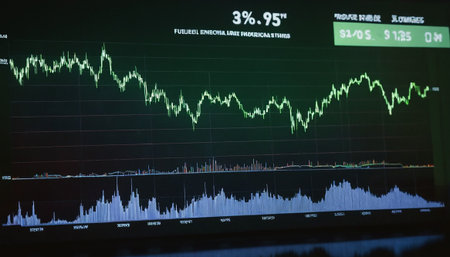
Shallow depth of field (selective focus) with details of a chart showing the stock market crash from March 2020 due to the Covid-19 pandemic on a computer screen (S&P500 index)
Коллекция по умолчанию
Коллекция по умолчанию
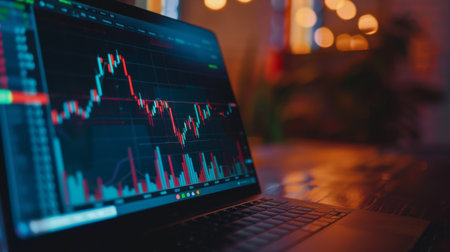
Создать новую
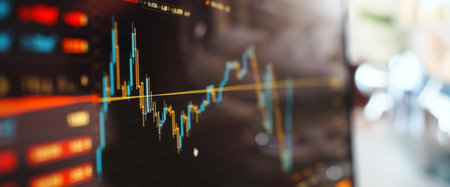
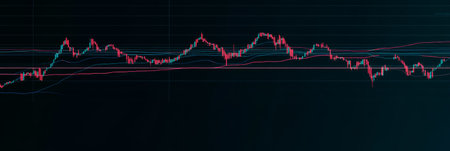
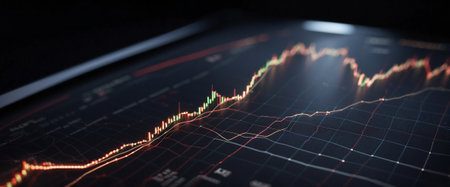
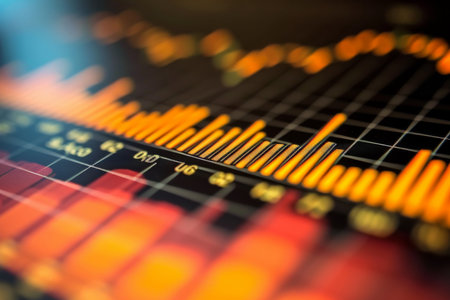
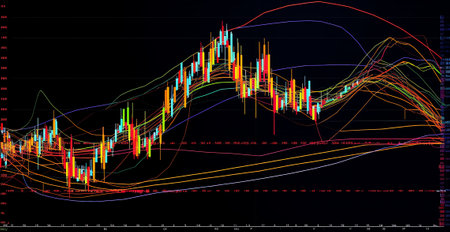
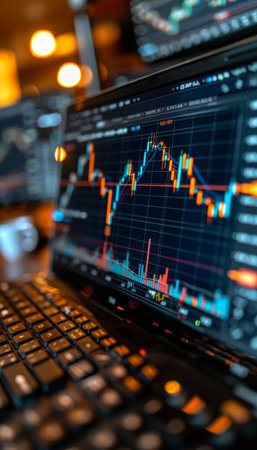
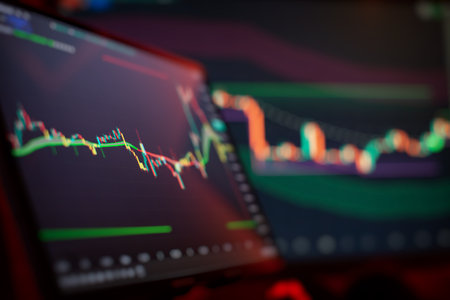
Trading stock. Stock market. Business graph. Trading investment. Broker. Stock exchange market.
Коллекция по умолчанию
Коллекция по умолчанию
Создать новую
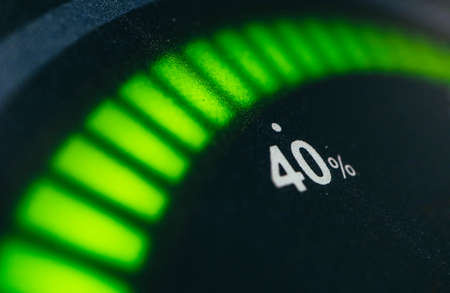
Fitness machine display sport exercise workout effectiveness, macro view.
Коллекция по умолчанию
Коллекция по умолчанию
Создать новую

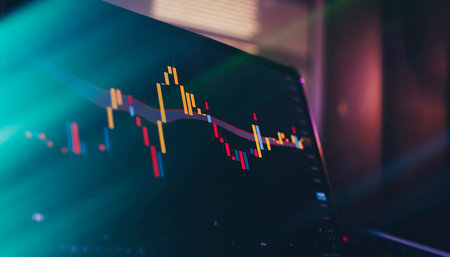
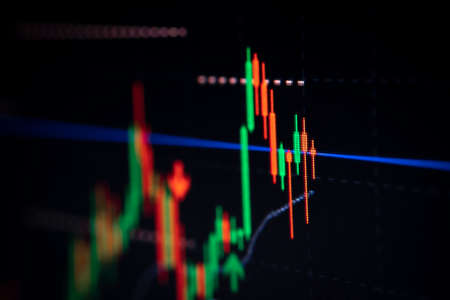
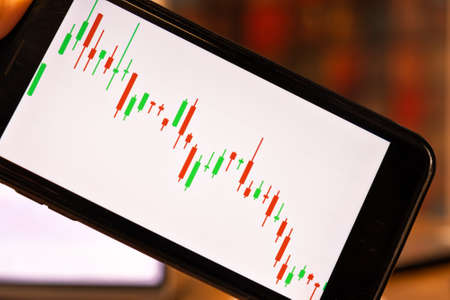
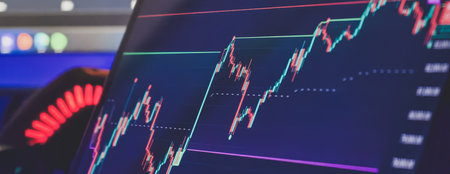
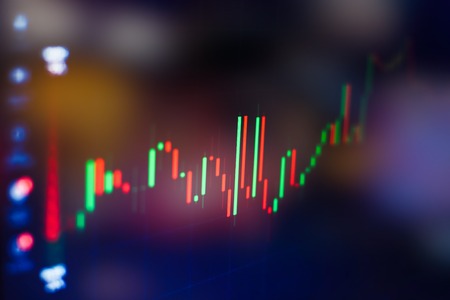
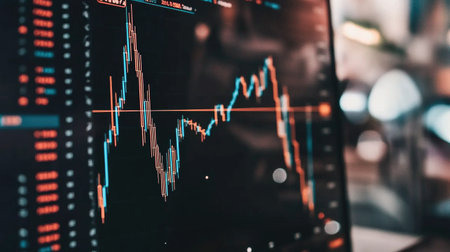
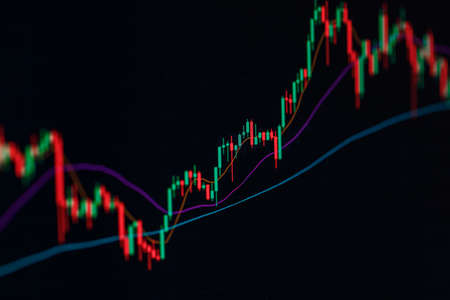
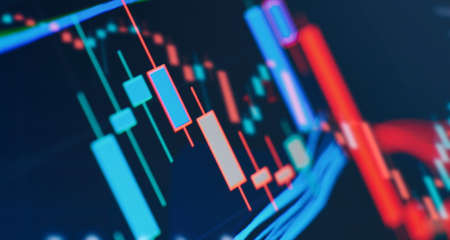
Candle stick graph chart with indicator showing bullish point or bearish point, up trend or down trend of price of stock market or stock exchange trading, investment and financial concept.
Коллекция по умолчанию
Коллекция по умолчанию
Создать новую

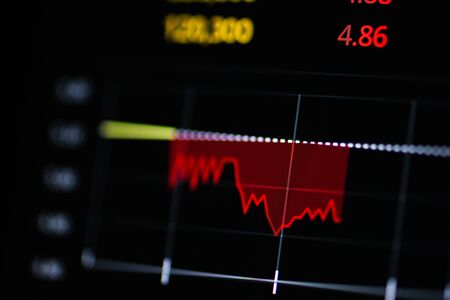
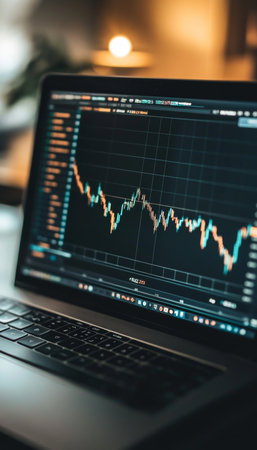
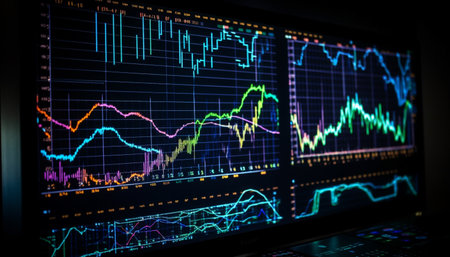
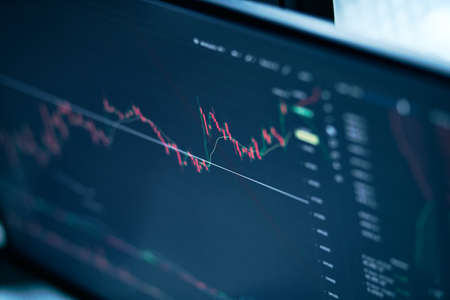
The Stock Exchange, Streaming Trade Screen, The stock screen shows a list of stocks with reduced value.
Коллекция по умолчанию
Коллекция по умолчанию
Создать новую
View of Stock Market Crash from Covid-19 Pandemic with shallow depth of field.
Коллекция по умолчанию
Коллекция по умолчанию
Создать новую

Financial stock market graph. Stock Exchange. Selective focus.
Коллекция по умолчанию
Коллекция по умолчанию
Создать новую
Analyzing investment statistics and indicators on dashboard for trading
Коллекция по умолчанию
Коллекция по умолчанию
Создать новую
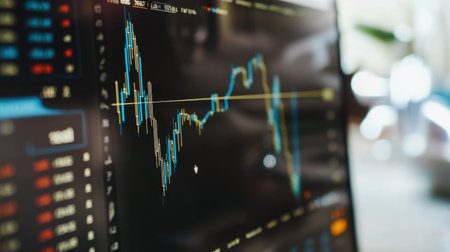
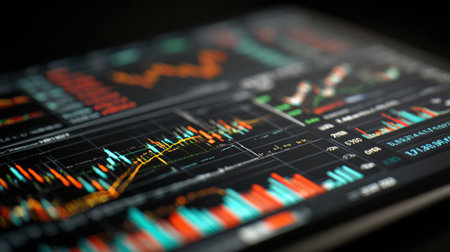
Business or Financial Reference: Displaying stock market data, stock exchange or chart on a monitor, stock market chart, stock exchange or chart. stock market investment trading chart.
Коллекция по умолчанию
Коллекция по умолчанию
Создать новую

Business financial or stock market background. Business graph on stock market financial exchange
Коллекция по умолчанию
Коллекция по умолчанию
Создать новую

Data analyzing in Forex, Commodities, Equities, Fixed Income and Emerging Markets: the charts and summary info show about Business statistics and Analytics value - Wealth management concept.
Коллекция по умолчанию
Коллекция по умолчанию
Создать новую

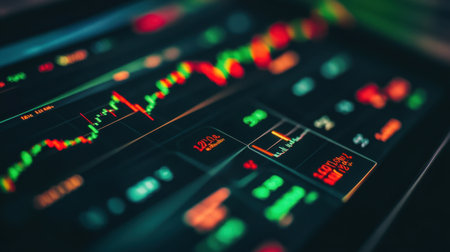
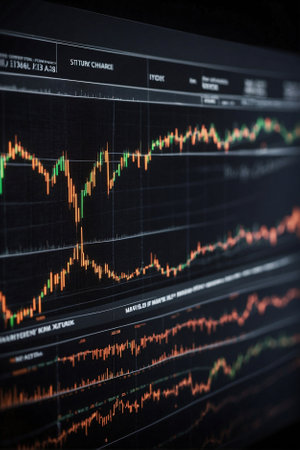
Vibrant candlestick patterns and descending trend lines illustrate a market downturn, highlighting analysis tools amid a somber financial atmosphere.
Коллекция по умолчанию
Коллекция по умолчанию
Создать новую

Fitness machine display sport exercise workout effectiveness, macro view.
Коллекция по умолчанию
Коллекция по умолчанию
Создать новую

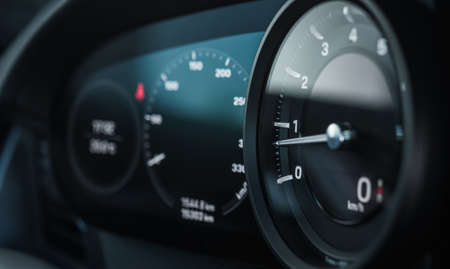
Close up shot with the digital speedometer of a car.
Коллекция по умолчанию
Коллекция по умолчанию
Создать новую

A detailed close-up view of a candlestick chart displaying stock data. The graphic illustrates financial trends with vibrant colors, aiding data analysis.
Коллекция по умолчанию
Коллекция по умолчанию
Создать новую

This close-up photograph captures the distinct red numbers on a clock, Numeric binary representation of a digital clock, AI Generated
Коллекция по умолчанию
Коллекция по умолчанию
Создать новую

Financial stock market graph. Stock Exchange. Selective focus.
Коллекция по умолчанию
Коллекция по умолчанию
Создать новую

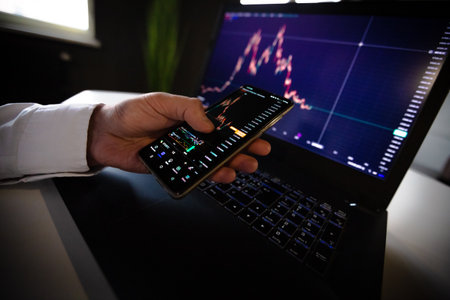
Trader investor broker holding finger using cell phone app executing financial stock trade market trading order to buy or sell
Коллекция по умолчанию
Коллекция по умолчанию
Создать новую
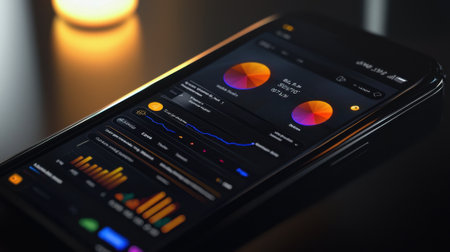
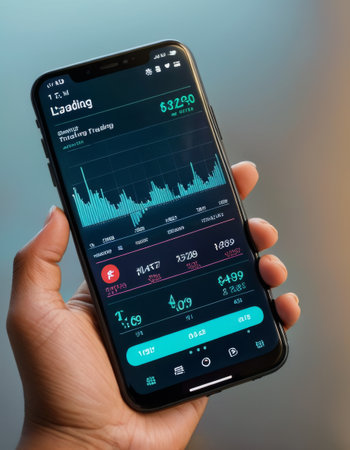
A sleek smartphone shows vibrant data charts and graphs against a dark background. The device captures attention with its user-friendly interface and illuminated ambiance.
Коллекция по умолчанию
Коллекция по умолчанию
Создать новую

Financial instruments with various types of indicators including volume analysis for professional technical analysis
Коллекция по умолчанию
Коллекция по умолчанию
Создать новую
Stainless steel washbasins for disinfection.
Коллекция по умолчанию
Коллекция по умолчанию
Создать новую
Abstract image of financial data and stock market analysis with colorful graphs and charts, representing economic trends and market fluctuations.
Коллекция по умолчанию
Коллекция по умолчанию
Создать новую

Financial stock market graph. Stock Exchange. Selective focus.
Коллекция по умолчанию
Коллекция по умолчанию
Создать новую
Rev Counter Tachometer Instrument in Modern Car Dashboard. Revolution-Counter Measuring Device. Automotive and Transportation Technology.
Коллекция по умолчанию
Коллекция по умолчанию
Создать новую
Colorful candlestick chart displaying bitcoin price trends and market volatility in cryptocurrency trading on a dark background
Коллекция по умолчанию
Коллекция по умолчанию
Создать новую

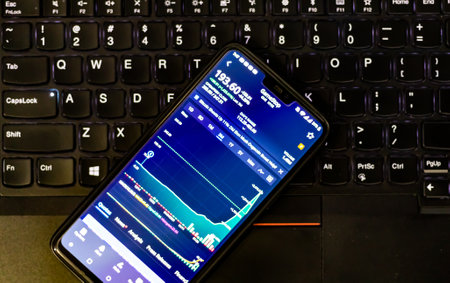
Real-time analysis of the cryptocurrency market in a smartphone. panorama, macro
Коллекция по умолчанию
Коллекция по умолчанию
Создать новую

Business and Economy Theme. Trading Cryptocurrencies. Stock Market Candles Chart on Computer Display Close Up.
Коллекция по умолчанию
Коллекция по умолчанию
Создать новую

Business statistics and Analytics value. Abstract glowing forex chart interface background. Investment, trade, stock, finance and analysis concept.
Коллекция по умолчанию
Коллекция по умолчанию
Создать новую
Investors sit and watch graphs of stock market data and watch the world market chart change, Investing in cryptocurrency in the stock market, Business people work on tablets and laptops.
Коллекция по умолчанию
Коллекция по умолчанию
Создать новую

Digital graph chart diagrams data of cryptocurrency, stock market or forex exchange price on computer display screen. Global business economy and financial rate on technology monitor. Money investment
Коллекция по умолчанию
Коллекция по умолчанию
Создать новую

Candle stick graph chart of stock market investment trading. The Forex chart on the digital screen. Bar graphs, Diagrams, financial figures. Forex chart.
Коллекция по умолчанию
Коллекция по умолчанию
Создать новую
Female hand with smartphone trading stock online. Business concept
Коллекция по умолчанию
Коллекция по умолчанию
Создать новую
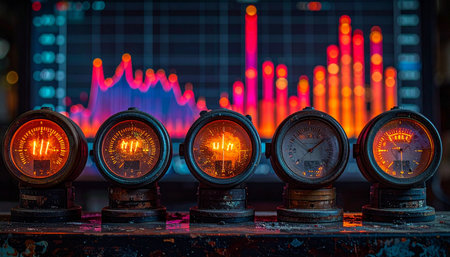
A row of vintage industrial gauges glows with warm intensity, actively monitoring the volatile fluctuations of a complex data chart displayed in the background.
Коллекция по умолчанию
Коллекция по умолчанию
Создать новую
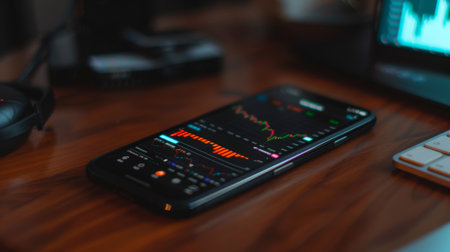
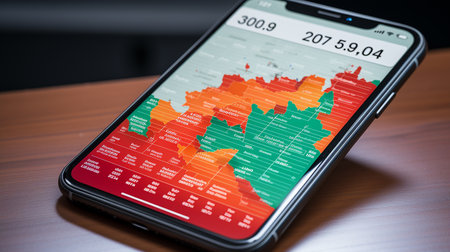
A smartphone displaying stock market graphs and charts, highlighting the convenience of mobile trading and investment monitoring
Коллекция по умолчанию
Коллекция по умолчанию
Создать новую

Illuminated motorbike control panel with speedometer and revs counter
Коллекция по умолчанию
Коллекция по умолчанию
Создать новую

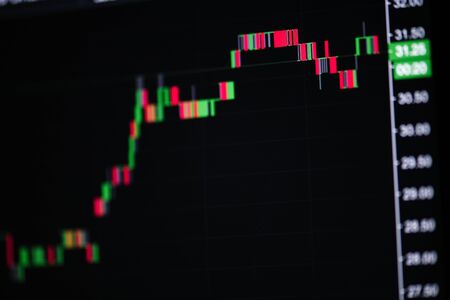
Stock market candlestick chart, asset prices movement, currency exchange price action simple concept. Computer screen, display, candle chart, graph detail, extreme closeup, nobody, no people
Коллекция по умолчанию
Коллекция по умолчанию
Создать новую
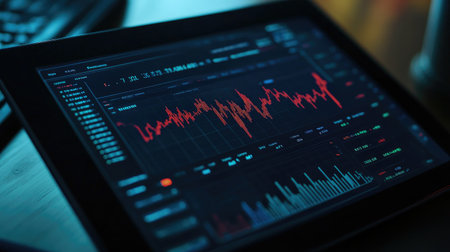
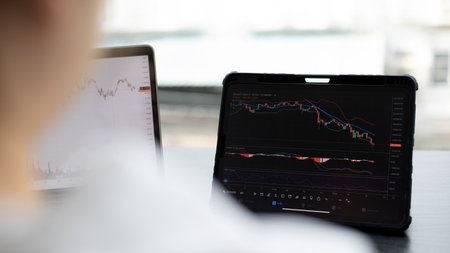
Detailed shot of a stock chart with market trends and performance metrics displayed on a tablet or laptop
Коллекция по умолчанию
Коллекция по умолчанию
Создать новую
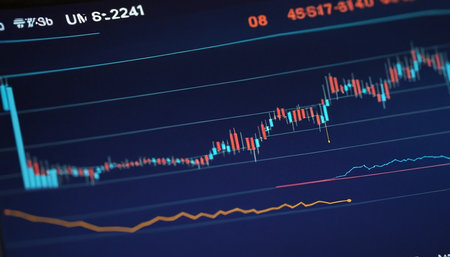
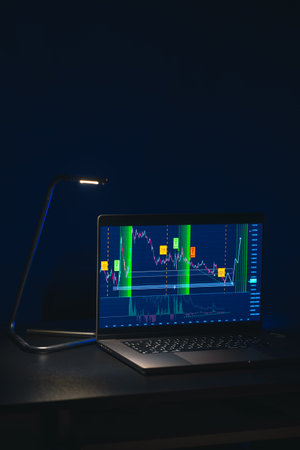
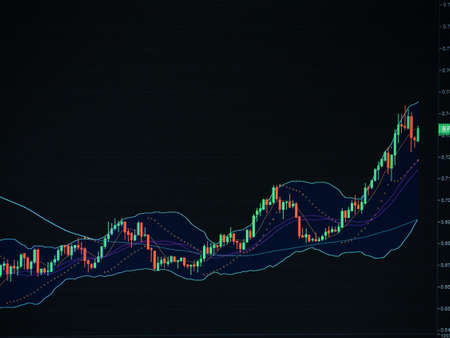
A close-up view of a digital financial chart displaying candlestick patterns in red and blue against a dark blue background. Multiple horizontal lines are visible, with an orange line graph trending upwards in the lower section and a blue line graph also showing an upward trend above a red horizontal line. Text are present at the of the screen.
Коллекция по умолчанию
Коллекция по умолчанию
Создать новую
Working set for analyzing financial statistics and analyzing a market data. Data analysis from charts and graphs
Коллекция по умолчанию
Коллекция по умолчанию
Создать новую
Stock growth chart. Rising market: bull trend. cryptocurrency market symbol.
Коллекция по умолчанию
Коллекция по умолчанию
Создать новую
Modern Smartphone Displaying Stock Charts
Коллекция по умолчанию
Коллекция по умолчанию
Создать новую
A Close Up Of A Speedometer On A Car. Generative AI
Коллекция по умолчанию
Коллекция по умолчанию
Создать новую
A vibrant image of a large monitor displaying a detailed gold price chart with various technical indicators and a prominent upward trend in gold prices.
Коллекция по умолчанию
Коллекция по умолчанию
Создать новую
Background of Stock market graph chart on LED display. Trading concept
Коллекция по умолчанию
Коллекция по умолчанию
Создать новую

Candle stick graph chart of stock market investment trading.
Коллекция по умолчанию
Коллекция по умолчанию
Создать новую
A financial chart illustrates a notable surge in stock market profits, fueled by rising interest rates and consistent growth in money investments during recent months.
Коллекция по умолчанию
Коллекция по умолчанию
Создать новую
Explore an engaging visual representation of stock market data featuring colorful candlestick charts, dynamic trends, and intricate analytics for financial analysis and insight.
Коллекция по умолчанию
Коллекция по умолчанию
Создать новую
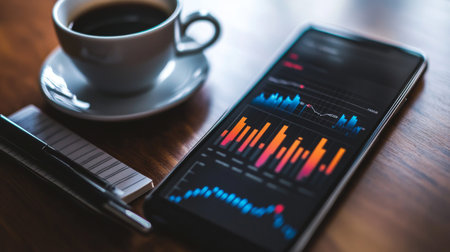
A smartphone displays vibrant financial data charts next to a steaming cup of coffee and notepad, creating a perfect workspace for business discussions and productivity.
Коллекция по умолчанию
Коллекция по умолчанию
Создать новую
Close up n hand holding smart phone with candle graph for trade stock market investment crypto currency
Коллекция по умолчанию
Коллекция по умолчанию
Создать новую
Financial Success Charts And Graphs Depict Booming Stock Market And Investments. Сoncept Financial Success, Stock Market, Investments, Charts And Graphs, Booming Economy.
Коллекция по умолчанию
Коллекция по умолчанию
Создать новую

Close Up hand holding air quality monitor to detect level of pollution or small particle (PM2.5) on sky background. image high pollution concept.
Коллекция по умолчанию
Коллекция по умолчанию
Создать новую
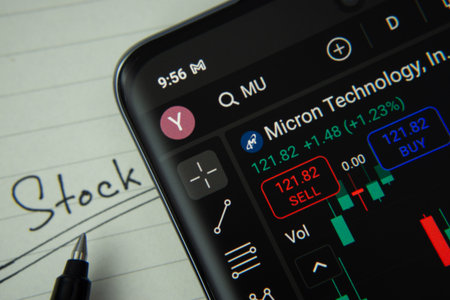
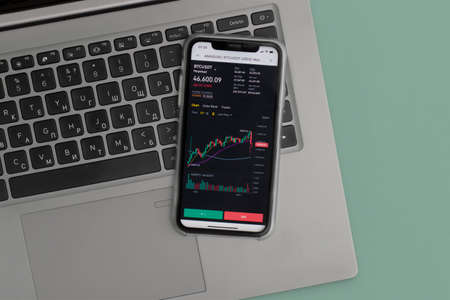
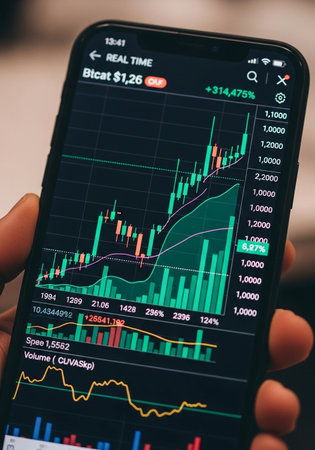
Dhaka, Bangladesh- 20 June 2025: Micron stock trading information on smartphone screen with a handwritten note.
Коллекция по умолчанию
Коллекция по умолчанию
Создать новую
financial state
Коллекция по умолчанию
Коллекция по умолчанию
Создать новую
Stock Market Chart on Dark Background: Financial Analytics. Digital Art: Modern Technologies
Коллекция по умолчанию
Коллекция по умолчанию
Создать новую
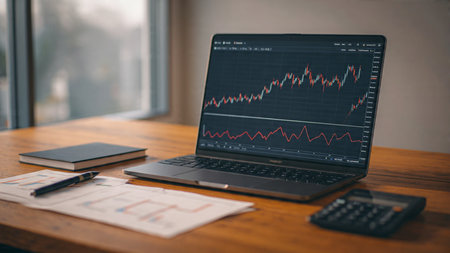
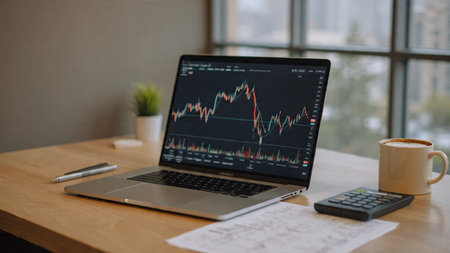
A minimalist wooden workspace showcasing laptop charts and supporting documents with coffee.
Коллекция по умолчанию
Коллекция по умолчанию
Создать новую
Kathmandu, Nepal - January 29 2021: Stock trading app on phone shows stock price of GME against GameStop logo.
Коллекция по умолчанию
Коллекция по умолчанию
Создать новую

Rpm car odometer detail symbol of power and speed
Коллекция по умолчанию
Коллекция по умолчанию
Создать новую
Stock market display on the mobile screen for analytic stock trade investors.
Коллекция по умолчанию
Коллекция по умолчанию
Создать новую
View of Stock Market Crash from Covid-19 Pandemic with shallow depth of field.
Коллекция по умолчанию
Коллекция по умолчанию
Создать новую
Checking price chart on digital exchange. Forex trading agency worker agent reviewing profits growth. Another crisis is coming and prices on the charts are falling down. finance business stock exchange graph chart, crypto, blockchain data analytics report analyzing. business man working on financial report. Binar. stockbroker. . High quality photo
Коллекция по умолчанию
Коллекция по умолчанию
Создать новую
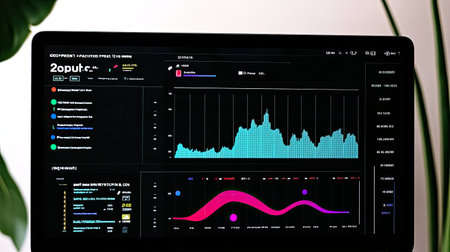
A sleek digital dashboard showcasing market analysis with engaging charts. Ideal for professionals seeking insights into financial performance and trends.
Коллекция по умолчанию
Коллекция по умолчанию
Создать новую
Stock market or forex trading graph
Коллекция по умолчанию
Коллекция по умолчанию
Создать новую

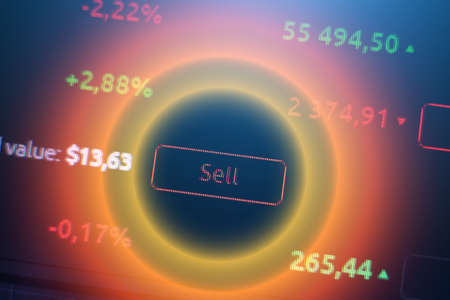
Stock exchange trading analysis investment financial on display crisis stock crash down and grow up gain and profits financial impact or forex graph Stock market digital graph chart business indicator
Коллекция по умолчанию
Коллекция по умолчанию
Создать новую
asset allocation concept graph on blackboard
Коллекция по умолчанию
Коллекция по умолчанию
Создать новую
Close-up of a digital screen showing a candlestick chart with rising financial data and technical indicators in a dark setting.
Коллекция по умолчанию
Коллекция по умолчанию
Создать новую
MOSCOW, RUSSIA - 11 SEP 2021: Stock market online. Business concept
Коллекция по умолчанию
Коллекция по умолчанию
Создать новую

image of the financial graph on a computer monitor.
Коллекция по умолчанию
Коллекция по умолчанию
Создать новую
Business success and growth concept.Stock market business graph chart on digital screen.Forex market, Gold market and Crude oil market
Коллекция по умолчанию
Коллекция по умолчанию
Создать новую

Graph line stock market business forex trading and analysis investment indicator of financial board display money price stock chart exchange growth and digital background
Коллекция по умолчанию
Коллекция по умолчанию
Создать новую
Intricate trading analytics display lively graphs and charts reflecting trading activity and stock price movements during market hours.
Коллекция по умолчанию
Коллекция по умолчанию
Создать новую
Close-up of a hand holding a smartphone with stock market data on display.
Коллекция по умолчанию
Коллекция по умолчанию
Создать новую

Analyzing financial statistics and analyzing a market data. Data analysis from charts and graphs
Коллекция по умолчанию
Коллекция по умолчанию
Создать новую
A calm working environment with market data screens and coffee paired with documents.
Коллекция по умолчанию
Коллекция по умолчанию
Создать новую
The Forex graph chart on the digital screen. Working set for analyzing financial statistics and analyzing a market data.
Коллекция по умолчанию
Коллекция по умолчанию
Создать новую
Bear market rebound vibrant blue graphs in the glow of sunrise, captured from a downward angle
Коллекция по умолчанию
Коллекция по умолчанию
Создать новую
A close-up view of an interactive stock trading chart on a tablet, showing candlestick patterns and technical indicators in a well-lit environment.
Коллекция по умолчанию
Коллекция по умолчанию
Создать новую
Visual representation of financial growth and investment trends for enhanced decision making
Коллекция по умолчанию
Коллекция по умолчанию
Создать новую
Candle stick graph chart with indicator showing bullish point or bearish point, up trend or down trend of price of stock market or stock exchange trading, investment and financial concept. thin focus.
Коллекция по умолчанию
Коллекция по умолчанию
Создать новую
Abstract digital financial chart with colored candlestick charts, trend lines
Коллекция по умолчанию
Коллекция по умолчанию
Создать новую

A closeup of the AIPowered Fitness Trackers screen displaying the users daily goals and achievements
Коллекция по умолчанию
Коллекция по умолчанию
Создать новую

Follow stock prices, stock quotes and the rise and fall of the cryptocurrency on a mobile tablet. The hand draws on the tablet screen using a stylus. close-up small depth of field
Коллекция по умолчанию
Коллекция по умолчанию
Создать новую
Stockmarket online trading chart candlestick on crypto currency platform. Stock exchange financial market price candles graph data pattern analysis concept. Computer screen closeup background
Коллекция по умолчанию
Коллекция по умолчанию
Создать новую
Futuristic computer graphic design analyzing wealth growth and balance generated by artificial intelligence
Коллекция по умолчанию
Коллекция по умолчанию
Создать новую
Close-up view of a mobile device displaying vibrant financial data. The visual representation features colorful charts and statistics amidst a blurred background.
Коллекция по умолчанию
Коллекция по умолчанию
Создать новую
Bar graphs, Diagrams, financial figures. Abstract glowing forex chart interface wallpaper.
Коллекция по умолчанию
Коллекция по умолчанию
Создать новую
Red financial stock market graph with rising and falling trends.
Коллекция по умолчанию
Коллекция по умолчанию
Создать новую

hands showing music application on a smart phone
Коллекция по умолчанию
Коллекция по умолчанию
Создать новую
Business and trading finance contept. Stock exchange market chart view on smart phone screen.
Коллекция по умолчанию
Коллекция по умолчанию
Создать новую

Temperature boiler thermometer control pressure gauge system water indicator.
Коллекция по умолчанию
Коллекция по умолчанию
Создать новую
Fule meter of a car shows empty
Коллекция по умолчанию
Коллекция по умолчанию
Создать новую
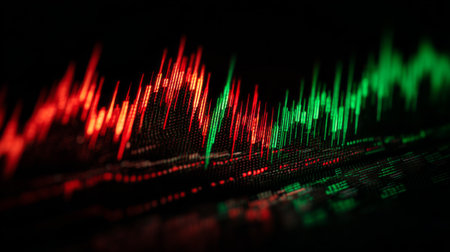
A vibrant abstract depiction of a stock market graph showcasing red and green lines. Ideal for themes of finance, trading analysis, and investment strategies.
Коллекция по умолчанию
Коллекция по умолчанию
Создать новую
Stock market or forex trading graph and candlestick chart suitable for financial investment concept. Economy trends background for business idea and all art work design. Abstract finance background.
Коллекция по умолчанию
Коллекция по умолчанию
Создать новую
Stock market or forex trading graph and candlestick chart suitable for financial investment concept. Economy trends background for business idea and all art work design. Abstract finance background.
Коллекция по умолчанию
Коллекция по умолчанию
Создать новую
forex trading graph and candlestick chart suitable for financial investment concept. Economy trends background for business idea and all art work design. Abstract finance background.
Коллекция по умолчанию
Коллекция по умолчанию
Создать новую
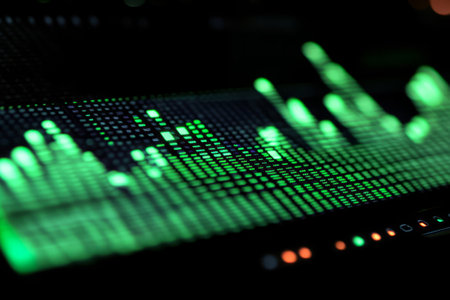
Glowing green digital financial chart displaying stock market trends and data analysis
Коллекция по умолчанию
Коллекция по умолчанию
Создать новую
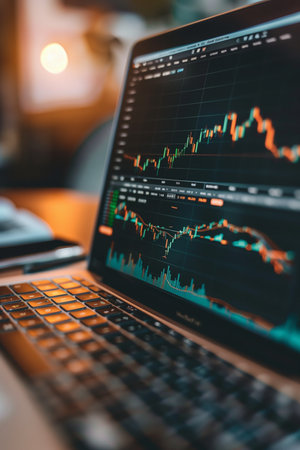
A close-up of a laptop screen displaying a stock market graph with fluctuating prices and trading volumes.
Коллекция по умолчанию
Коллекция по умолчанию
Создать новую

forex trading graph and candlestick chart suitable for financial investment concept. Economy trends background for business idea and all art work design. Abstract finance background.
Коллекция по умолчанию
Коллекция по умолчанию
Создать новую
graph of financial growth on a computer monitor. cryptocurrency.
Коллекция по умолчанию
Коллекция по умолчанию
Создать новую

Financial stock market graph on the smartphone screen on wooden background with a computer beside it. Top view. Stock Exchange.
Коллекция по умолчанию
Коллекция по умолчанию
Создать новую

A mesmerizing close-up of vibrant speedometers with neon lights set against a rocky backdrop, creating a futuristic atmosphere filled with color and energy.
Коллекция по умолчанию
Коллекция по умолчанию
Создать новую
Legion-Media
Создайте свои проекты на основе качественных стоковых фотографий и видео.


Copyright © Legion-Media.